
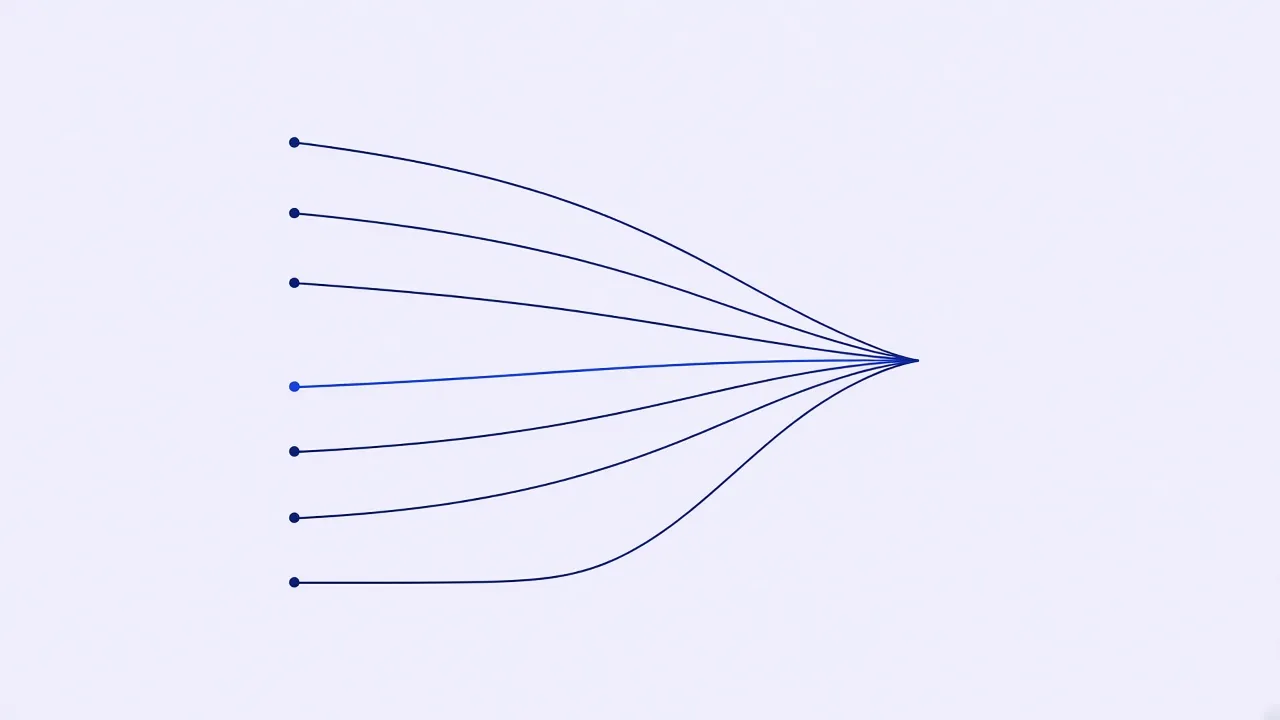
Average response time is the most common number on a monitoring dashboard and one of the least useful. A few very slow requests disappear inside an average, but those are the requests users remember. Percentiles show what the average hides.
1. What a percentile means
The p95 response time is the time under which 95% of checks completed. If your p95 is 400 ms, 1 in 20 checks took longer than that. Percentiles describe the experience of real slices of traffic, not an imaginary typical request.
2. Read p50 as the typical case
The p50, or median, is what most requests feel like. It is a better typical value than the average because a handful of slow outliers cannot pull it up. If p50 rises, almost everyone is slower.
3. Read p95 and p99 as the tail
The tail is where problems start. A rising p99 with a flat p50 often points to a slow database query, a cold cache or one unhealthy instance. Navy response time charts show p50, p95 and p99 together so you can see the gap.
4. Compare regions
Response times from 18 regions tell you more than one number. A spike in one region usually means a network or CDN issue. A spike everywhere usually means your service. Split the chart by region before you start debugging.
5. Alert on percentiles, not averages
Set performance alerts on p95 or p99 over a short window. An alert on the average fires late, after the tail has already been bad for a while. Keep thresholds a little above your normal p95 so they catch real changes and ignore noise.
6. Watch trends over weeks
Slow regressions do not trigger alerts. Compare this week’s p95 with last month’s. A service that gets 10 ms slower with every release will be noticeably slower in a quarter, and nobody will know which change did it.
| Percentile | What it tells you | Typical use |
|---|---|---|
| p50 | The typical request | Baseline and trends |
| p95 | Most of your slow requests | Performance alerts |
| p99 | The worst regular experience | Finding tail problems |
Averages answer the wrong question. Look at p50 for the typical case, p95 and p99 for the tail, and alert on the numbers your users actually feel.